 Get 50% off on Vault theme. Limited time offer!
 Top 10 Application Monitoring Tools in 2025
Because businesses rely heavily on applications in a digital environment, how well they run and whether they are reliable now matter a lot for success. When enterprises spread their technology across different cloud, on-premises, and hybrid environments, managing those solutions grows much tougher. Complexity in IT systems has led to the need for advanced Application Monitoring Tools, user and health performance. These tools spot problems that could affect users ahead of time and help sustain ideal performance, cut downtime and create smooth user experiences.
This year, monitoring equipment has seen a lot of development, as artificial intelligence and machine learning are now helping to predict issues and fix problems without human help. Now, businesses have ways to predict how operations might clog, pinpoint unusual situations, and suggest positive changes before anything major happens. Thanks to this proactive method, DevOps teams no longer have to spend much time on firefighting and can concentrate on being innovative.
What are Application Monitoring Tools?
Such tools function as software designed to keep track of and report back on the performance, availability and function of applications in various areas. Thanks to these tools, businesses can notice issues immediately, use resources properly and improve application performance for end-users.
Various monitoring approaches, such as the ones listed below, are included in Modern Application Monitoring Tools:
- Application Performance Monitoring:Concentrates on analyzing how quickly application code works, how each transaction is processed and how quickly results are offered.
- Use of Real User Monitoring (RUM): Analyzes the ways people use applications to learn about their experiences and behaviors.
- Synthetic Monitoring: Simulation of user actions on applications helps locate problems that could affect real users if left undetected.
- Infrastructure Monitoring: Follows the operation of servers, networks, and databases within the systems that support applications.
- Log Management: Takes log data from both applications and infrastructure, combines it, and studies the data to handle problems and notice common trends.
Most of these tools show dashboards that display visuals, send alerts, and allow teams to look at reports to assess how well the application is working. Today’s leading monitoring approaches in 2025 depend on AI for spotting issues, examining what went wrong, and providing anticipatory info, allowing organizations to respond proactively to changes in their application landscape. To complement these AI-driven monitoring systems, SCA tools can scan software components for vulnerabilities, helping teams proactively identify and fix security risks before they impact application performance or user trust.
Why do we need Application Monitoring Tools?
- Visibility: Nowadays, application environments involve dealing with several clouds, types of containers and various microservices. With monitoring tools, distributed systems are easier to track since users can see how the application performs all through the system in one place. If we didn’t have visibility, it would be nearly impossible to find the causes of these issues.
- Prevention: Solving problems within a business before end-users notice them greatly benefits organizations. Efficient monitoring tools recognize changes in behavior, point out unusual cases, and warn ahead of any failures so teams can tackle risks that might negatively affect users and the company’s reputation.
- Optimization: Besides finding problems, monitoring tools also help improve your website’s performance. They detect slow parts in the code, areas where resources are wasted and ways the application uses its resources, helping teams boost application speed and cut costs by better organizing resources.
- Collaboration: By offering a shared set of tools and terms, today’s monitoring solutions unite development, operations and business teams. It simplifies dialogue during incident handling, shortens the time it takes to resolve trouble and helps people collaborate more effectively in handling performance problems.
- Compliance: Strict rules about application availability, how systems perform and how secure they are exist for many industries. With these monitoring tools, organizations show that they follow the regulations, so they do not get fined and provide consistent service to their customers.
- Innovation: These tools free up technical teams from doing routine jobs by handling data monitoring and offering useful guidance from the data you receive. Because of this, organizations can speed up their transformation projects, try out new ideas and catch up with the competition in fast-changing business fields.
Comparison Table for Application Monitoring Tools
| Tool | Overall Rating | Best For |
| Datadog | 4.8/5 | Organizations requiring comprehensive monitoring across diverse environments |
| New Relic | 4.7/5 | Teams seeking deep code-level insights with minimal overhead |
| Dynatrace | 4.8/5 | Complex enterprise environments with mission-critical applications |
| SolarWinds AppOptics | 4.5/5 | Budget-conscious organizations needing broad coverage |
| AppDynamics | 4.7/5 | Businesses focused on connecting performance to revenue metrics |
| Honeycomb | 4.6/5 | Organizations with complex, distributed systems |
| Prometheus | 4.5/5 | Kubernetes-native environments and cost-sensitive deployments |
| Zabbix | 4.4/5 | Organizations with specialized monitoring requirements |
| Instana | 4.6/5 | Dynamic environments with frequent changes |
| Splunk | 4.7/5 | Organizations prioritizing SecOps integration |
Top 10 Application Monitoring Tools
1. Datadog
Type: SaaS-based Full-Stack Observability Platform
Rating: 4.8/5
Website: www.datadog.com
Datadog is designed to assist with monitoring and analytics for any organization’s infrastructure, applications, logs, and how users are experiencing them. The powerful APM tools in this platform rely on AI tracing to help see the inner workings of applications at the code level. Its special ability to tie metrics together in the technology stack allows Datadog to present a comprehensive view of the health of any application. The platform is excellent for new cloud-native systems and also for age-old, classic architecture, which is why it benefits organizations changing with digital transformation. With its many available integrations, Datadog unites with virtually all modern technology elements to allow for quick setup and fast value.
Key Features:
- AI-powered anomaly detection
- Distributed tracing capabilities
- Synthetic monitoring framework
- Network performance visualization
- Continuous deployment tracking
Pros:
- Extensive integration ecosystem
- Intuitive unified dashboard
- Comprehensive alerting options
Cons:
- Complex pricing structure
- Potentially overwhelming interface
- Higher data retention costs
Pricing: Datadog offers tiered pricing based on hosts, metrics, and features.
2. New Relic
Type: Cloud-based Observability Platform
Rating: 4.7/5
Website: www.newrelic.com
New Relic gives engineering teams the resources needed to successfully build, deploy, and run their software. One of its best points is that transaction data, including metrics, events, traces, and logs, is all well-organized and accessed in one location. Performance problems can be identified exactly because you can look at the code, while the solution connects with over 750 popular DevOps systems and cloud services. By bringing together technical monitoring and business metrics, New Relic allows organizations to see how their applications affect both users and their overall outcomes. Their free service plan gives enough tools to monitor even the smallest applications or beginning teams.
Key Features:
- Full-stack observability platform
- Real-user experience monitoring
- Serverless function monitoring
- Kubernetes cluster visualization
- Intelligent alert management
Pros:
- Developer-friendly interface design
- Powerful query language
- Generous free tier
Cons:
- Data ingestion costs
- Feature fragmentation issues
- Configuration complexity exists
Pricing: Organizations pay $0.30 per GB of data ingested
3. Dynatrace
Type: AI-Powered Observability Platform
Rating: 4.8/5
Website: www.dynatrace.com
The AI engine, Davis, helps Dynatrace stand out by finding and investigating any issues it encounters automatically. Applications running in any environment—on-premises, in the cloud, or in a hybrid way—are made highly visible because OneAgent accesses and records their dependencies automatically. Enterprise monitoring with Dynatrace is possible because it can follow transactions in microservices, containers, and cloud systems. SimplyClouds OnPremises automatically identifies applications and builds a topology map that gives real-time insight into the environment and its effects on performance. Thanks to this comprehensive design, Dynatrace is especially important for large enterprises with key applications.
Key Features:
- AI-driven problem identification
- Automatic dependency mapping
- Digital experience monitoring
- Cloud infrastructure insights
- Security vulnerability detection
Pros:
- Precise root-cause analysis
- Extensive automation capabilities
- Comprehensive dependency visualization
Cons:
- Premium pricing structure
- Steeper learning curve
- Resource-intensive agent deployment
Pricing: Full-stack monitoring starts at $69 per month
4. SolarWinds AppOptics
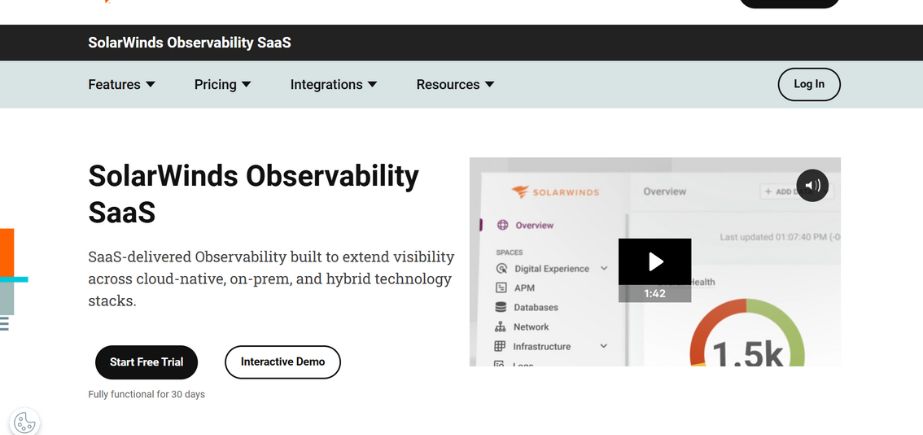
Type: Hybrid Monitoring Solution
Rating: 4.5/5
Website: www.solarwinds.com/appoptics
SolarWinds AppOptics gives you comprehensive reports and monitoring across all parts of your application, server, and infrastructure setup for less money. The platform is distinguished by its effortless monitoring and by offering distributed tracing, live code profiling, and exception tracking. AppOptics links easily with major cloud platforms like AWS and Azure and shows you how resources are performing and being used. It becomes even more powerful by mixing infrastructure, application, and custom metrics on a single dashboard. The method enables teams to find and resolve performance problems faster across the different parts of a technology stack, which is helpful for mid-sized organizations with many IT systems.
Key Features:
- Full-stack infrastructure visualization
- Cloud resource optimization
- Database performance analysis
- Customizable alerting system
- Distributed tracing capabilities
Pros:
- Excellent value proposition
- Quick implementation process
- Comprehensive dashboard customization
Cons:
- Less advanced AI capabilities
- Limited mobile application support
- Fewer third-party integrations
Pricing: starting at $9.99 per host per month
5. AppDynamics
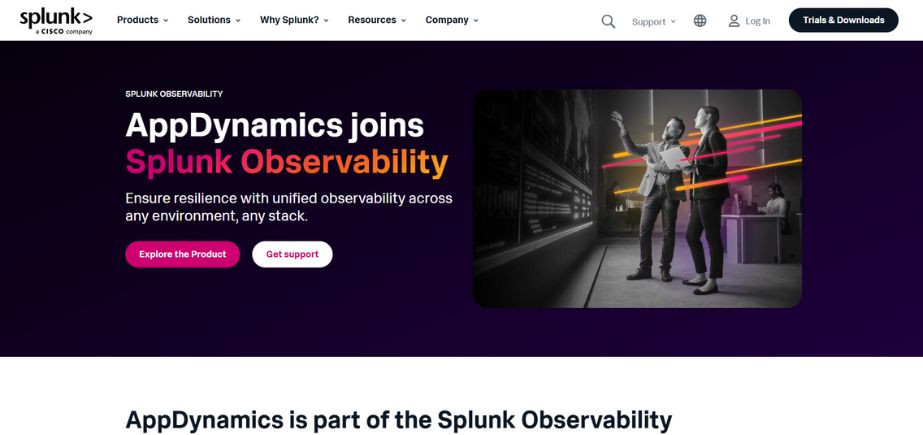
Type: Business-Centric APM Platform
Rating: 4.7/5
Website: www.appdynamics.com
Cisco owns AppDynamics, a tool that relates how an app works to a company’s success using Business iQ. Experience Monitoring is strong at tracking user actions across web and mobile apps, and Features Experience Journey Mapping, which helps find where improvements can be made. AppDynamics stands out by helping users understand their application’s progress by comparing technical data with business metrics like how many people complete conversions or how much revenue is earned. With the business approach, companies focus on boosting results that will impact the company instead of making changes just for technical reasons. The platform works in cloud, in-house, and mixed deployment types, making it valuable to companies with many application categories.
Key Features:
- Business performance correlation
- Automated baseline establishment
- Microservices monitoring framework
- Transaction snapshot analysis
- Mobile application monitoring
Pros:
- Business-centric performance visualization
- Detailed transaction tracing
- Comprehensive dependency mapping
Cons:
- Higher implementation complexity
- Premium pricing structure
- Resource-intensive agent deployment
Pricing: $60 per month per unit
Read More:
6. Honeycomb
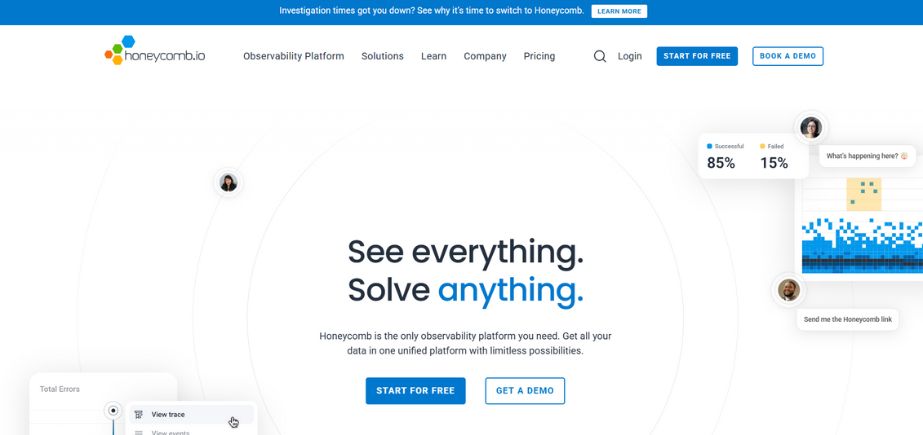
Type: High-Cardinality Observability Platform
Rating: 4.6/5
Website: www.honeycomb.io
The platform was designed by Honeycomb specifically with developers in mind and to recognize issues in large, distributed systems. Honeycomb performs well on uncommon and diverse data, and it manages irregular system events better than any other monitoring tool because of its unique methods. With the platform, software engineers and operators are empowered to investigate all the behaviors inside their systems, exploring billions of execution paths without set dashboards or alerts. The BubbleUp feature from Honeycomb allows anomalies and patterns to be identified across countless dimensions at once, speeding up the process of correcting problems. Thanks to this technique, Honeycomb stands apart for organizations with microservices that may fail in unexpected ways.
Key Features:
- High-cardinality data exploration
- Advanced query capabilities
- Distributed tracing visualization
- Service health monitoring
- Team collaboration workflows
Pros:
- Superior debugging capabilities
- Exceptional query flexibility
- Powerful pattern detection
Cons:
- Steeper learning curve
- Less infrastructure monitoring
- Limited predefined dashboards
Pricing: $130/month for 100M events
7. Prometheus
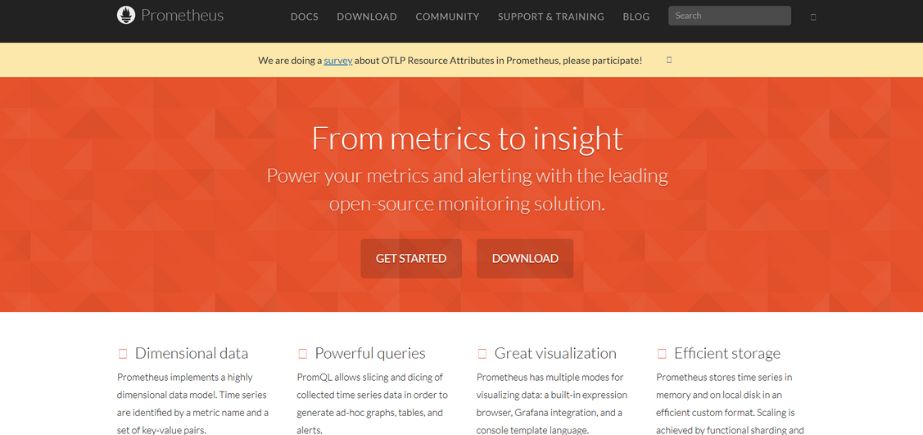
Type: Open-Source Monitoring System
Rating: 4.5/5
Website: prometheus.io
Prometheus is now the main choice for monitoring in Kubernetes and cloud-native settings. This open-source system is designed to monitor user-selected targets and regularly collect the data, which it saves as part of a time series. The query language (PromQL) offered by Prometheus is what enables a detailed study of all metrics collected. Dimensional data modeling on the platform is effective, and you can use labels to make queries and calculations on metrics. You can visualize the data from Prometheus using Grafana, which together make a solid open-source monitoring solution. Although it is built mostly based on metrics, its flexible architecture and ease of finding services help it fit well in continually evolving container environments.
Key Features:
- Time-series data collection
- Powerful query language
- Dynamic target discovery
- Flexible alerting system
- Kubernetes-native monitoring
Pros:
- Zero licensing costs
- Highly scalable architecture
- Extensive community support
Cons:
- Steeper implementation curve
- Limited built-in visualization
- Requires additional components
Pricing: free to use
8. Zabbix
Type: Enterprise-Grade Open-Source Monitoring
Rating: 4.4/5
Website: www.zabbix.com
Zabbix enables enterprise monitoring with great flexibility and the ability to personalize it. To get data, the platform uses lightweight agents for some sources, and it can use common protocols such as SNMP, IPMI, and JMX for agentless approaches. A major advantage of Zabbix is that it supports IT infrastructure monitoring for network devices, applications, and services. Third-party Integration is strong because custom scripts and plugins help companies track various metrics. Even though Zabbix is not as dedicated to distributed tracing as some other APM tools, it is very efficient at understanding and watching IT systems with many different technologies.
Key Features:
- Network device monitoring
- Automated discovery capability
- Low-level discovery functions
- An extensive templating system
- Flexible notification methods
Pros:
- Comprehensive customization options
- No licensing costs
- Excellent scalability potential
Cons:
- Steeper configuration complexity
- Less intuitive interface
- Limited cloud-native capabilities
Pricing: Zabbix is open-source and free to use.
9. Instana
Type: Automated APM Solution
Rating: 4.6/5
Website: www.instana.com
What sets Instana, now part of IBM, apart is its automated method for checking application performance. Without manual setup, the platform identifies all applications, services, and infrastructure parts and outlines how they all depend on one another. Instana is particularly strong because it constantly monitors in real time, measures metrics every second, and updates application maps as the environment changes on its own. As a result, it is particularly useful for environments that use modern, moving container technologies since traditional monitoring solutions find these hard to manage. After a deployment or change in infrastructure, the platform immediately lets teams see how the changes are affecting the system’s behavior and user experiences in large distributed systems.
Key Features:
- Automatic application discovery
- Real-time dependency mapping
- One-second metric granularity
- Continuous deployment monitoring
- Precise trace correlation
Pros:
- Minimal configuration requirements
- Exceptional visualization capabilities
- Superior containerized monitoring
Cons:
- Limited historical data retention
- Less customization flexibility
- Higher resource requirements
Pricing: $75 per host per month annually
10. Splunk

Type: Data-to-Everything Platform
Rating: 4.7/5
Website: www.splunk.com
Splunk takes a unique method for application monitoring by joining security, observability, and business analytics into one system. While it was mostly used for log management, Splunk has now added application monitoring to its services through Observability Cloud. The software does a great job of analyzing huge amounts of machine data from several sources, making it simple to match application performance, security events, and company outcomes. Because of its strong search system, Splunk enables different teams to undertake detailed analysis over the entire set of monitoring data. By doing this, Splunk is especially useful for businesses wanting to bring together IT operations, security, and business analytics teams.
Key Features:
- Unified security monitoring
- Advanced analytics capabilities
- Complete transaction tracing
- Comprehensive log analysis
- Business intelligence integration
Pros:
- Powerful search capabilities
- Extensive correlation possibilities
- Security-performance integration
Cons:
- Significant resource requirements
- Steeper learning curve
- Higher licensing costs
Pricing: $1,800 per GB per year
Tips for Choosing the Application Monitoring Tools
- Requirements: Document your particular needs for monitoring as your primary step. Focus on the software technologies, your underlying application design, ways of deploying and the qualifications of your team. Make sure you focus on capabilities that tackle your biggest problems, instead of choosing a tool that others use just because it’s famous.
- Scalability: Be sure to see how your monitoring solutions react as your application becomes larger. Review both how well the monitoring platform will handle growing needs and what the costs will be as usage increases. A technology that looks affordable to your first group might become far too expensive as your company increases in scale.
- Integration: See whether the monitoring technology can harmonize well with what you already have. The best tools integrate easily with your development frameworks, where you deploy, your notification software and your tickets. With strong integration, implementation barrier is reduced and the data from monitoring stays meaningful across the entire life cycle of your applications.
- Usability: Check what expertise is necessary to put in place and look after each type of monitoring solution. Many fancy features won’t help much if your team has trouble using or understanding the platform. Choose tools that are easy to use, well-documented and provide materials that fit your team’s skills and help them advance professionally.
- ROI: Determine the total cost of owning the software; it is not limited to the fees you pay at first. Be sure to think about what it would cost to put the system into place, to maintain it, to train users and to upgrade it over time. Evaluate the costs against advantages, including less downtime, simpler issue discovery, happy customers and new activities for engineers, to see which system will give you the best ROI.
Conclusion
Because of how difficult and important modern apps have become, Application Monitoring Tools have rapidly developed in 2025. All the tools studied in this piece present different means to uphold application performance, dependability, and security as systems operate without boundaries.
Organizations moving forward with digital transformation rely on Application Monitoring Tools to help succeed in business, not only to keep systems online. Top monitoring solutions offer insights that make it easy for organizations to recognize steps that will improve satisfaction for customers and boost income.
Applying more automation, increasing AI use and strengthening links between monitoring results and immediate, automated corrections are the future of application monitoring. As these tools are developed further, we will experience better prediction and prevention of problems, automatic tuning of applications according to instant data and improved analysis for business users from the monitoring information.
As you choose a monitoring tool, think about what your organization requires now and what it might require in the future. Good Application Monitoring Tools adjust to your changing infrastructure and still bring useful insights as your applications get larger and more complicated. Using a strategic system to monitor applications, organizations can change a simple necessity into something that supports innovation and improves the experience of their customers.
FAQs
What is the difference between APM and application monitoring tools?
Application Performance Monitoring (APM) is part of application monitoring that solely examines how code performs, how transactions are processed, and how slow or fast the system responds. To cover all aspects of applications, Comprehensive Application Monitoring Tools offer APM in addition to both server and device monitoring, tracking user experiences, handling logs, and monitoring security.
How do application monitoring tools impact development teams?
Good monitoring software speeds up development by informing users quickly about code performance, finding possible issues and allowing decisions to be based on facts. They allow developers to see how their code behaves in production, cut down on debugging by tracking transactions and encourage continuous enhancements using performance comparisons and trend studies.
Are open-source application monitoring tools suitable for enterprise environments?
When used and supported correctly, open-source tools such as Prometheus and Zabbix can be very successful for enterprises. However, it’s important for organizations to include in their calculation the price of onboarding, keeping their solution updated and any potential issues with scalability. A large number of enterprises prefer using commercial systems or open-source tools supported by vendors to maintain reliability and cut costs.
How has AI changed application monitoring in recent years?
Because of artificial intelligence, application monitoring has moved from only reacting to problems to being able to catch issues and predict them. Using AI, these tools set what is considered a baseline for performance, notice changes from regular operations, relate different incidents, and predict future problems, so user detection and resolution time is cut by a lot.
What security considerations should be evaluated when implementing application monitoring?
It is important for organizations to consider data collecting practices, where data is held, how long it is kept and who can access it when implementing monitoring tools. Check if the monitoring tools safeguard your data in transit and at rest, allow different access to data based on job roles and have powerful audit features. Also, look into whether using monitoring solutions can create security problems for your applications or network.