In the current digital era, every online company relies on servers. Regardless of whether you have a small website or a large company network of servers, it is highly essential that your servers are operational. Here is where the server monitoring tools come in. These tools will assist you in monitoring your servers 24/7, alert you in case anything goes wrong, and ensure that there is no problem at all. This article will discuss the 10 best server monitoring tools that will enable you to serve your servers with ease and efficiency.
What Are Server Monitoring Tools?
The server monitoring tools are special computer programs that monitor your servers 24 hours a day. Imagine them as guards over your computer servers. They will verify their servers are performing, whether they are quick enough, and whether they have any issues. These tools see a lot, such as CPU usage, memory, disk space, network speed, and application performance.
Server monitoring tools will alert you when something is not functioning as intended by email, SMS, or mobile messages. In this manner, you will be able to correct the issues in a short time before your users can detect something amiss. IT teams find it easy to use server monitoring tools that ensure businesses operate without failing the servers.
Benefits of Using Server Monitoring Tools
1. Real-time Alerts System: Give yourself immediate and instant notification in case of something wrong.
2. Better Resource Management: Understand clearly the amount of CPU used, the amount of memory used, amount of disk used.
3. Historical Data Reports: Look at the previous performance to undertake improvements and upgrades.
4. Automatic Issue Detection: Problems, however, are always identified in advance before turning into great catastrophes with the help of tools.
5. Increased Uptime Guarantee: Retain servers at 99.9% of the time, which made its customers happy.
Top 10 Server Monitoring Tools
1. Nagios
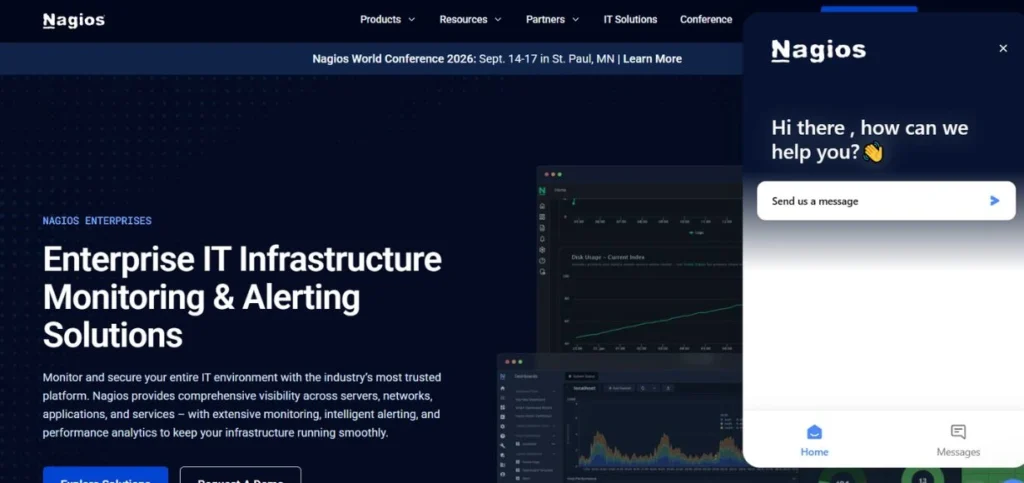
Nagios is an IT industry one of the most trusted and oldest monitoring tools for servers. It has been in existence since 199,9 and it is being utilized by thousands of companies across the world. Nagios is an open source which is used to monitor your total IT infrastructure, such as servers, applications, networks, and services.
It will be able to monitor Linux and Windows servers. The tool is very customizable, and with a large number of users who develop extensions and plugins. Nagios has full monitoring features and is able to monitor anything as simple from server pings, or as sophisticated as application performance measurements.
Key Features
- Monitor: It is a network service that monitors continuously.
- Notifications system, Customizable alert system.
- A wide variety of available plugin architectures.
Pros
- Free and open-source
- Large community support
- Highly customizable setup
Cons
- Complex initial setup
- Outdated user interface design.
- Needs technical expertise.
Best For: Enterprises
Pricing: Free (Core), Paid plans start at $1,995/year
Website: https://www.nagios.org
2. Datadog
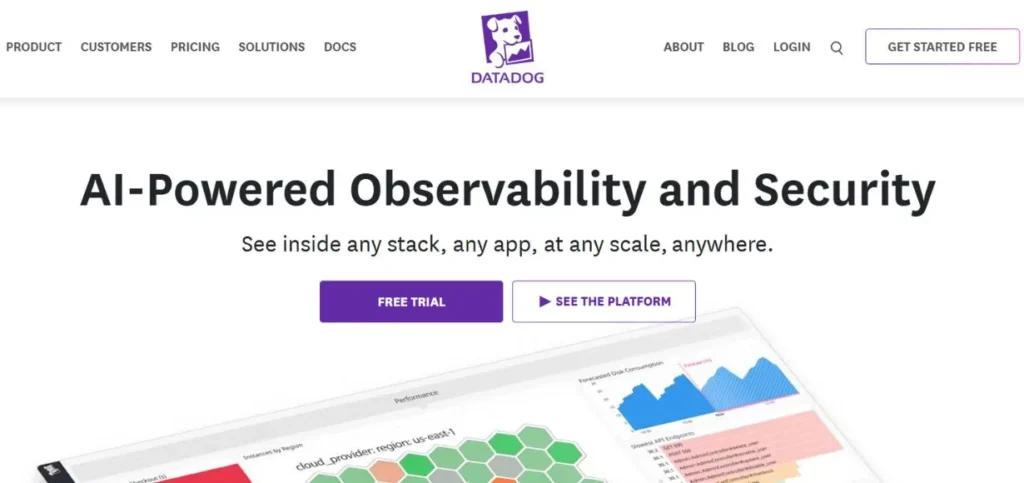
Datadog is a general-purpose modern cloud-based monitoring platform that is now very popular with businesses of any scale. It offers powerful cloud server monitoring tools that work seamlessly across different environments. Datadog gives you real-time visibility of your complete infrastructure in beautiful graphics and dashboards.
The tool is capable of tracking servers, databases, applications, containers, and cloud services. It is highly versatile since it has the ability to integrate with more than 500 technologies. Datadog involves machine learning to identify anomalies automatically and forecast possible problems before they occur.
Key Features
- Cloud platform monitoring.
- Artificial intelligence-driven anomaly detection.
- 500+ technology integrations
Pros
- Attractive, intuitively designed dashboards.
- Excellent mobile app
- Powerful documentation facilities.
Cons
- Expensive for teams
- Complex pricing structure
- Learning curve exists
Best For: Startups
Pricing: Free tier available, Paid plans from $15/host/month
Website: https://www.datadoghq.com
3. Zabbix

Zabbix is a highly robust enterprise-level monitoring system, which is fully open source. It can be considered as one of the most appropriate server monitoring tools used by companies that require professional features but do not invest in licenses. Zabbix is capable of monitoring thousands of servers at once and manages extremely large infrastructures with ease.
The tool is very efficient in monitoring networks, servers, cloud services, applications, and databases. Zabbix comes with auto-discovery capabilities, which means that it will automatically identify new devices in your network and begin monitoring them. It offers real-time tracking on a granularity of one second and archived past data for trend analysis.
Key Features
- Automatic identification of network equipment.
- Live track record facilities.
- Conditions: Customizable trigger conditions.
Pros
- Completely free forever
- Scales very well
- Development community in action.
Cons
- Installation takes time
- Needs database knowledge
- Paperwork might be better.
Best For: Enterprises
Pricing: Free and open-source
Website: https://www.zabbix.com
4. PRTG Network Monitor
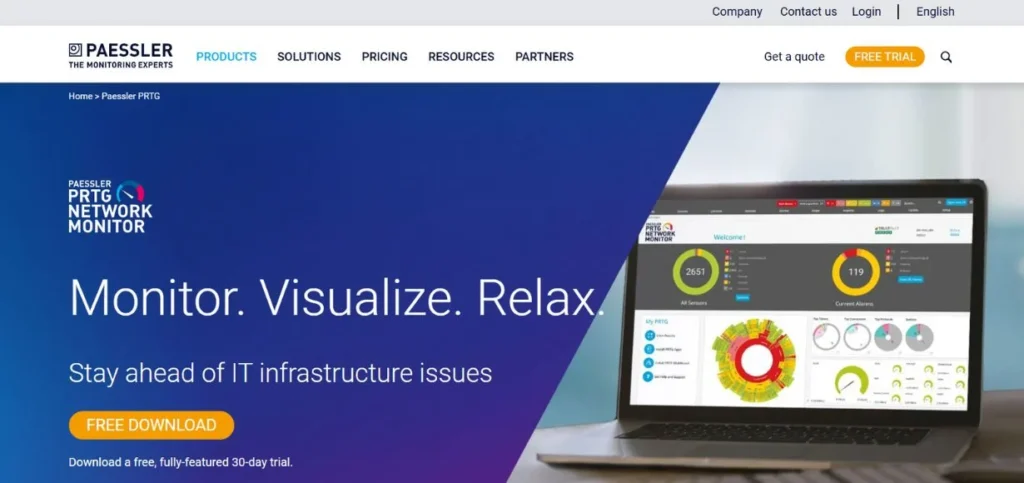
PRTG Network Monitor by Paessler is an easy-to-use monitoring solution that is aimed at simplicity and fast installation. It is particularly common with small to medium-sized enterprises, as it is so easy to establish and operate. PRTG has sensors that check on various things that are related to your infrastructure, and you are able to view everything in a single central dashboard. The tool identifies all the devices in your network automatically and constructs a network map of the connections between all devices.
PRTG includes Windows server monitoring tools that work perfectly with Microsoft environments. It also tracks bandwidth utilization, applications, virtual servers, and IoT devices. The interface itself is highly user-friendly with the use of color-coded notifications that allow for promptly identifying the issues at hand.
Key Features
- Auto-discovery of the infrastructure of networks.
- 250+ pre-configured sensors
- Easy drag-drop dashboards
Pros
- Very easy setup
- Beautiful modern interface
- Great Windows integration
Cons
- Expensive at scale
- A server based on Windows is required.
- Limited Linux support
Best For: SMBs
Pricing: Free for 100 sensors, Paid from $1,750
Website: https://www.paessler.com
5. SolarWinds Server & Application Monitor
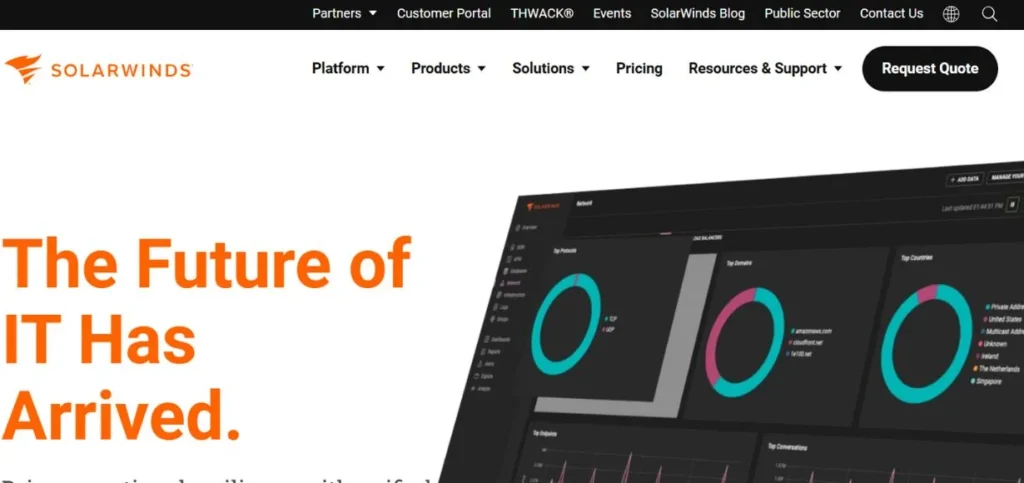
SolarWinds Server & Application Monitor (SAM) is a highly trusted monitoring solution that is used by IT professionals all over the world. It offers a profound understanding of how your servers perform and how your applications are doing in your entire infrastructure. SolarWinds offers some of the best Windows server monitoring tools available in the market today. The software tracks physical servers, virtual machines, cloud instances, and applications at a single location.
It contains more than 1,200 pre-configured monitors on such popular applications as SQL Server, Exchange, IIS, or Apache. The tool relies on the AppStack dashboard as a visualization tool to view application dependencies and troubleshoot problems quickly. SolarWinds SAM makes recommendations that are predictive to avoid issues before they affect users.
Key Features
- 1,200+ templates of monitoring.
- Application dependency mapping.
- Anticipatory failure analysis.
Pros
- Complete coverage of monitoring.
- An excellent reporting ability.
- Strong Windows support
Cons
- High-cost investment
- Can be resource-intensive
- Complex for beginners
Best For: Enterprises
Pricing: Starting at $2,995 (up to 150 monitors)
Website: https://www.solarwinds.com
Also Read: Best Broken Link Checker Tools
6. Prometheus
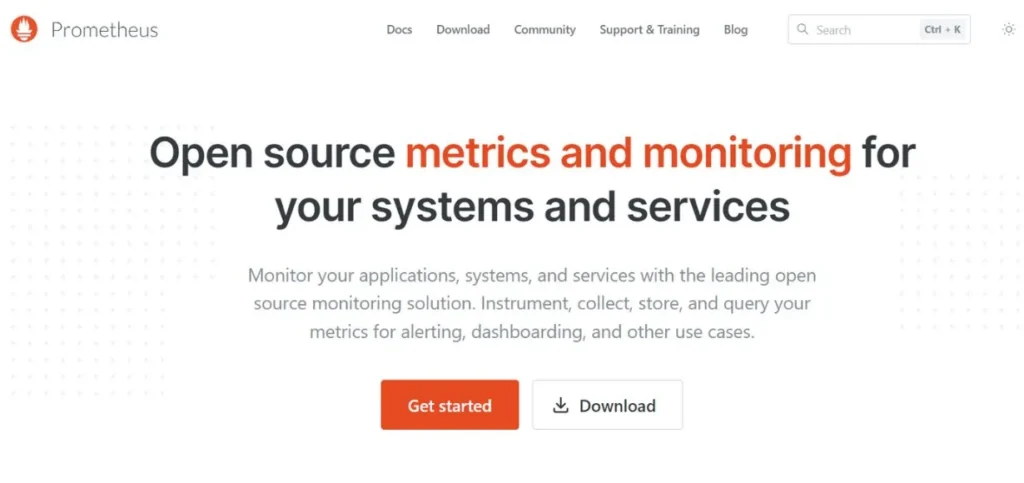
Prometheus is a recent open-source monitoring tool that is designed to support dynamic clouds and container orchestrators. It has been adopted as the universal monitoring tool of Kubernetes clusters and microservices architectures. Prometheus is a database based on time-series, which is highly efficient in storing metrics and offers a highly expressive query language called PromQL to analyze the data. The tool works perfectly as Linux server monitoring software and integrates seamlessly with Grafana for beautiful visualizations.
Prometheus applies the pull model, in which it scrapes metrics from your applications and servers periodically. It has an in-built alert manager which sends alerts when certain conditions are achieved. Prometheus is popular with many cloud-native companies due to its horizontal scaling capabilities and the ease with which it can be used to manage millions of metrics.
Key Features
- Inbuilt time-series database.
- Elastic PromQL query language.
- Mechanisms of service discovery.
Pros
- Perfect for Kubernetes
- Open-source and free
- Great community ecosystem
Cons
- Steeper learning curve
- No built-in dashboards
- Storage limitations exist
Best For: DevOps
Pricing: Free and open-source
Website: https://prometheus.io
7. New Relic
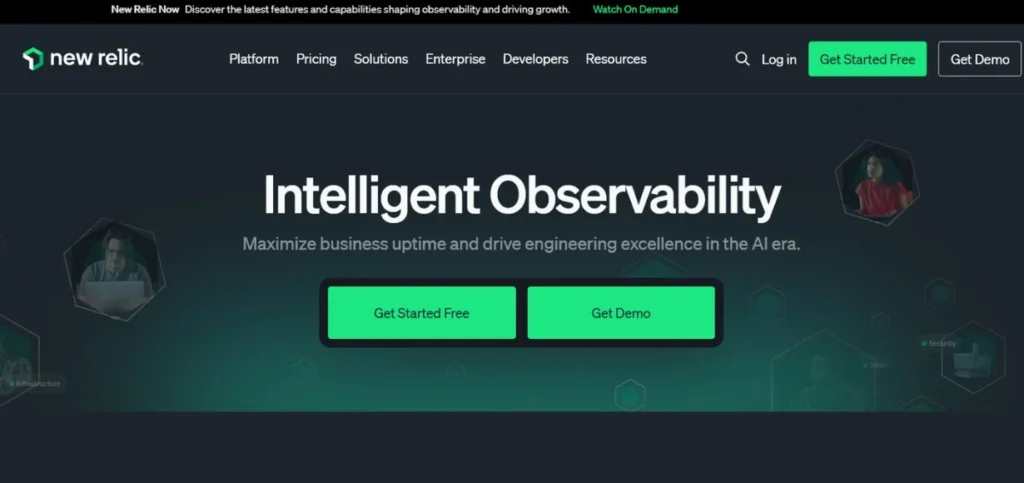
New Relic is an observability platform that is based on a full-stack monitoring system, replacing traditional server monitoring tools to offer total visibility of your applications and infrastructure. It provides real-time observability that has beautiful visualizations to enable teams to gain insight into system behavior fast. New Relic offers a single platform of application performance monitoring (APM), infrastructure monitoring, log management, and user experience monitoring.
The tool automatically measures your code to gather performance information in detail without involving manual setup. The AI engine of New Relic is called Applied Intelligence, and it is the automatic analysis of patterns and correlation of issues within your stack.
Key Features
- Full-stack observability solution.
- Artificial intelligence incident intelligence.
- Ability to trace occurring remotely.
Pros
- All-inclusive surveillance software.
- Easy agent installation
- Excellent user interface
Cons
- Expensive pricing model
- Can be overwhelming
- Data retention limits
Best For: Developers
Pricing: Free tier available, Paid from $49/month
Website: https://newrelic.com
8. ManageEngine OpManager
ManageEngine OpManager is a network and server monitoring tool created to assist the IT administrator who requires a feature-rich product with low prices. It has detailed monitoring of servers, routers, switches, firewalls, and virtual machines on a single console. OpManager includes excellent web server monitoring tools that track Apache, IIS, Nginx, and other web servers effectively. The software presents more than 2,000 best practices monitoring templates that are fast and convenient to set up.
OpManager will have automatic network discovery, automated alerting, and custom dashboards that display the real-time status of your complete infrastructure. It is also effective with small businesses, as well as large businesses that have a distributed location on a global scale.
Key Features
- 2,000+ monitoring templates
- Network topology mapping
- Multi-site monitoring assistance.
Pros
- Affordable pricing options
- Easy to deploy
- Good technical support
Cons
- The interface looks outdated
- Limited cloud monitoring
- The mobile application should be upgraded.
Best For: IT-Teams
Pricing: Free for 10 devices, Paid from $245
Website: https://www.manageengine.com
9. Checkmk
Checkmk is an effective IT monitoring tool that is a blend of the features of commercial and open-source server monitoring tools. It is available in two versions: Raw Edition (free) and Enterprise Edition (paid). Checkmk is also efficient at monitoring servers, networks, applications, containers, cloud services, and IoT. The tool employs s smart algorithm to filter out false alerts and concentrates on actual issues that need to be addressed.
Checkmk also has automatic service discovery, which identifies all the services that can be monitored on your servers and creates monitoring automatically. It offers agent-based and agentless monitoring facilities with regard to your needs. The tool is highly scalable and is capable of tracking tens of thousands of devices through one server.
Key Features
- Service discovery using the automation path.
- Smart alert filtering
- Hybrid monitoring approach
Pros
- Powerful free version
- Scales incredibly well
- Low resource consumption
Cons
- Setup complexity exists
- The documentation might be made better.
- Fewer integrations are offered.
Best For: Professionals
Pricing: Free (Raw Edition), Enterprise from €600/year
Website: https://checkmk.com
10. Icinga
Icinga is a new open source monitoring system that was initially developed as a fork of Nagios, but has become a far more sophisticated monitoring system. It offers dynamic server monitoring solutions that have an advanced architecture and exquisite web interface. Icinga checks the availability and performance of your network resources, creates performance information to be reported, and notifies you that there is a problem.
The tool comes with the Icinga 2 (core monitoring engine) and Icinga Web (user interface) as distinct entities that integrate perfectly well with each other. The icinga supports a distributed monitoring system whereby you are able to monitor thousands of servers at various locations. It also has strong filtering and search features that enable you to locate information at a fast rate within large settings.
Key Features
- Contemporary modular building.
- Monitoring support Distributed monitoring.
- Powerful REST API
Pros
- Free and flexible
- Modern clean interface
- Active development team
Cons
- Arduous preliminary order.
- Smaller community size
- Fewer plugins available
Best For: Administrators
Pricing: Free and open-source
Website: https://icinga.com
How to Choose the Right Server Monitoring Tools
1. Consider Your Budget: Free tools are good, but the paid ones provide more.
2. Requirements of Compatibility of Checks: Make sure that the operating systems, as well as the infrastructure, are being supported by the tools.
3. Evaluate Scalability Needs: Select tools that expand with your business.
4. Look at Integration: Pick tools into your existing software stack.
5. Test User Interface: Select dashboards of tools that you are familiar with and prefer.
Conclusion
Any business that uses a server to run its activities must have server monitoring tools. Whether you need cloud server monitoring tools, Linux server monitoring software, Windows server monitoring tools, or web server monitoring tools, there are excellent options available for every need and budget. The 10 server monitoring tools mentioned in this paper have various features, prices, and abilities to meet the various needs. There is a free open-source option, such as Nagios, Zabbix, and Prometheus, as well as the complete paid option, such as Datadog, New Relic, and SolarWinds, so you can find the ideal solution for your infrastructure.
The trick is to know what exactly you need, try various server monitoring programssand find the one that meets your technical needs and financial resources. It is worth keeping in mind that by spending money on good server monitor tools, you will save money tomorrow on costly downtime as well as bad-tempered customers. Now is the time to start keeping an eye on your servers, and now that you know that your infrastructure is being 24/7 watched over by trusted server monitoring tools.
Also Read: Best A/B Testing Tools Options
Frequently Asked Questions (FAQs)
Q1: What are server monitoring tools?
Server monitoring software is programs that observe your servers round the clock, monitor their performance, and inform you in case of problems so that you may correct them promptly.
Q2: What is the rationale behind monitoring the tools of the servers?
You require server monitoring systems to avoid downtimes, enhance performance, save on the cost of making emergency repairs, identify security threats early, and ensure that your servers remain in a smooth running state.
Q3: Are free server monitoring tools suitable?
Freely available server monitors such as Nagios, Zabbix,x, and Prometheus are a great product and are utilized in numerous large businesses, yet they need additional technical expertise to work correctly.
Q4: What is the cost of server monitoring tools?
Depending on features, number of servers, and level of support required, server monitoring tools can be offered as free open-source monitoring tools or paid monitoring tools ranging from $ 15 to $2,995 and more per month.
Q5: Do the server monitoring tools support cloud servers?
Yes, the majority of current server monitoring tools are fully compatible with cloud servers in AWS, Azure, Google Cloud, and other cloud networks, some of which are explicitly cloud-native.